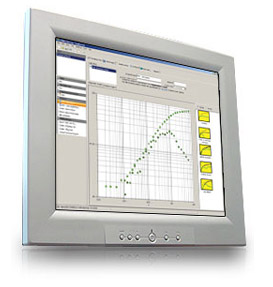
 | 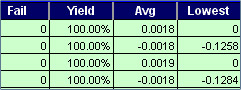 | | Data Cruncher features the most commonly used statistical calculations (Average, Standard Deviation and CPK) and presented in a report for easy analysis. Statistical Data from more than one lot can be shown side by side for easy comparison. |
|  | 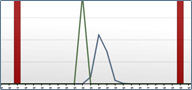 | | Histogram of test parameters can be produced to show trends in parametric test results. Data from more than one lots can be combined and analyzed in one chart. |
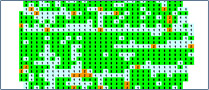
|  | 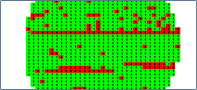 | | Shows a graphical map of binning test results, color coded with the bin number indicated for easy identification. Clicking on a die will show XY coordinates and bin value. |
|  |  | | Applicable to wafer probe data for showing a graphical map of binning results for a number of wafers. Tally of failed bins per wafer die position is displayed on screen. |
|